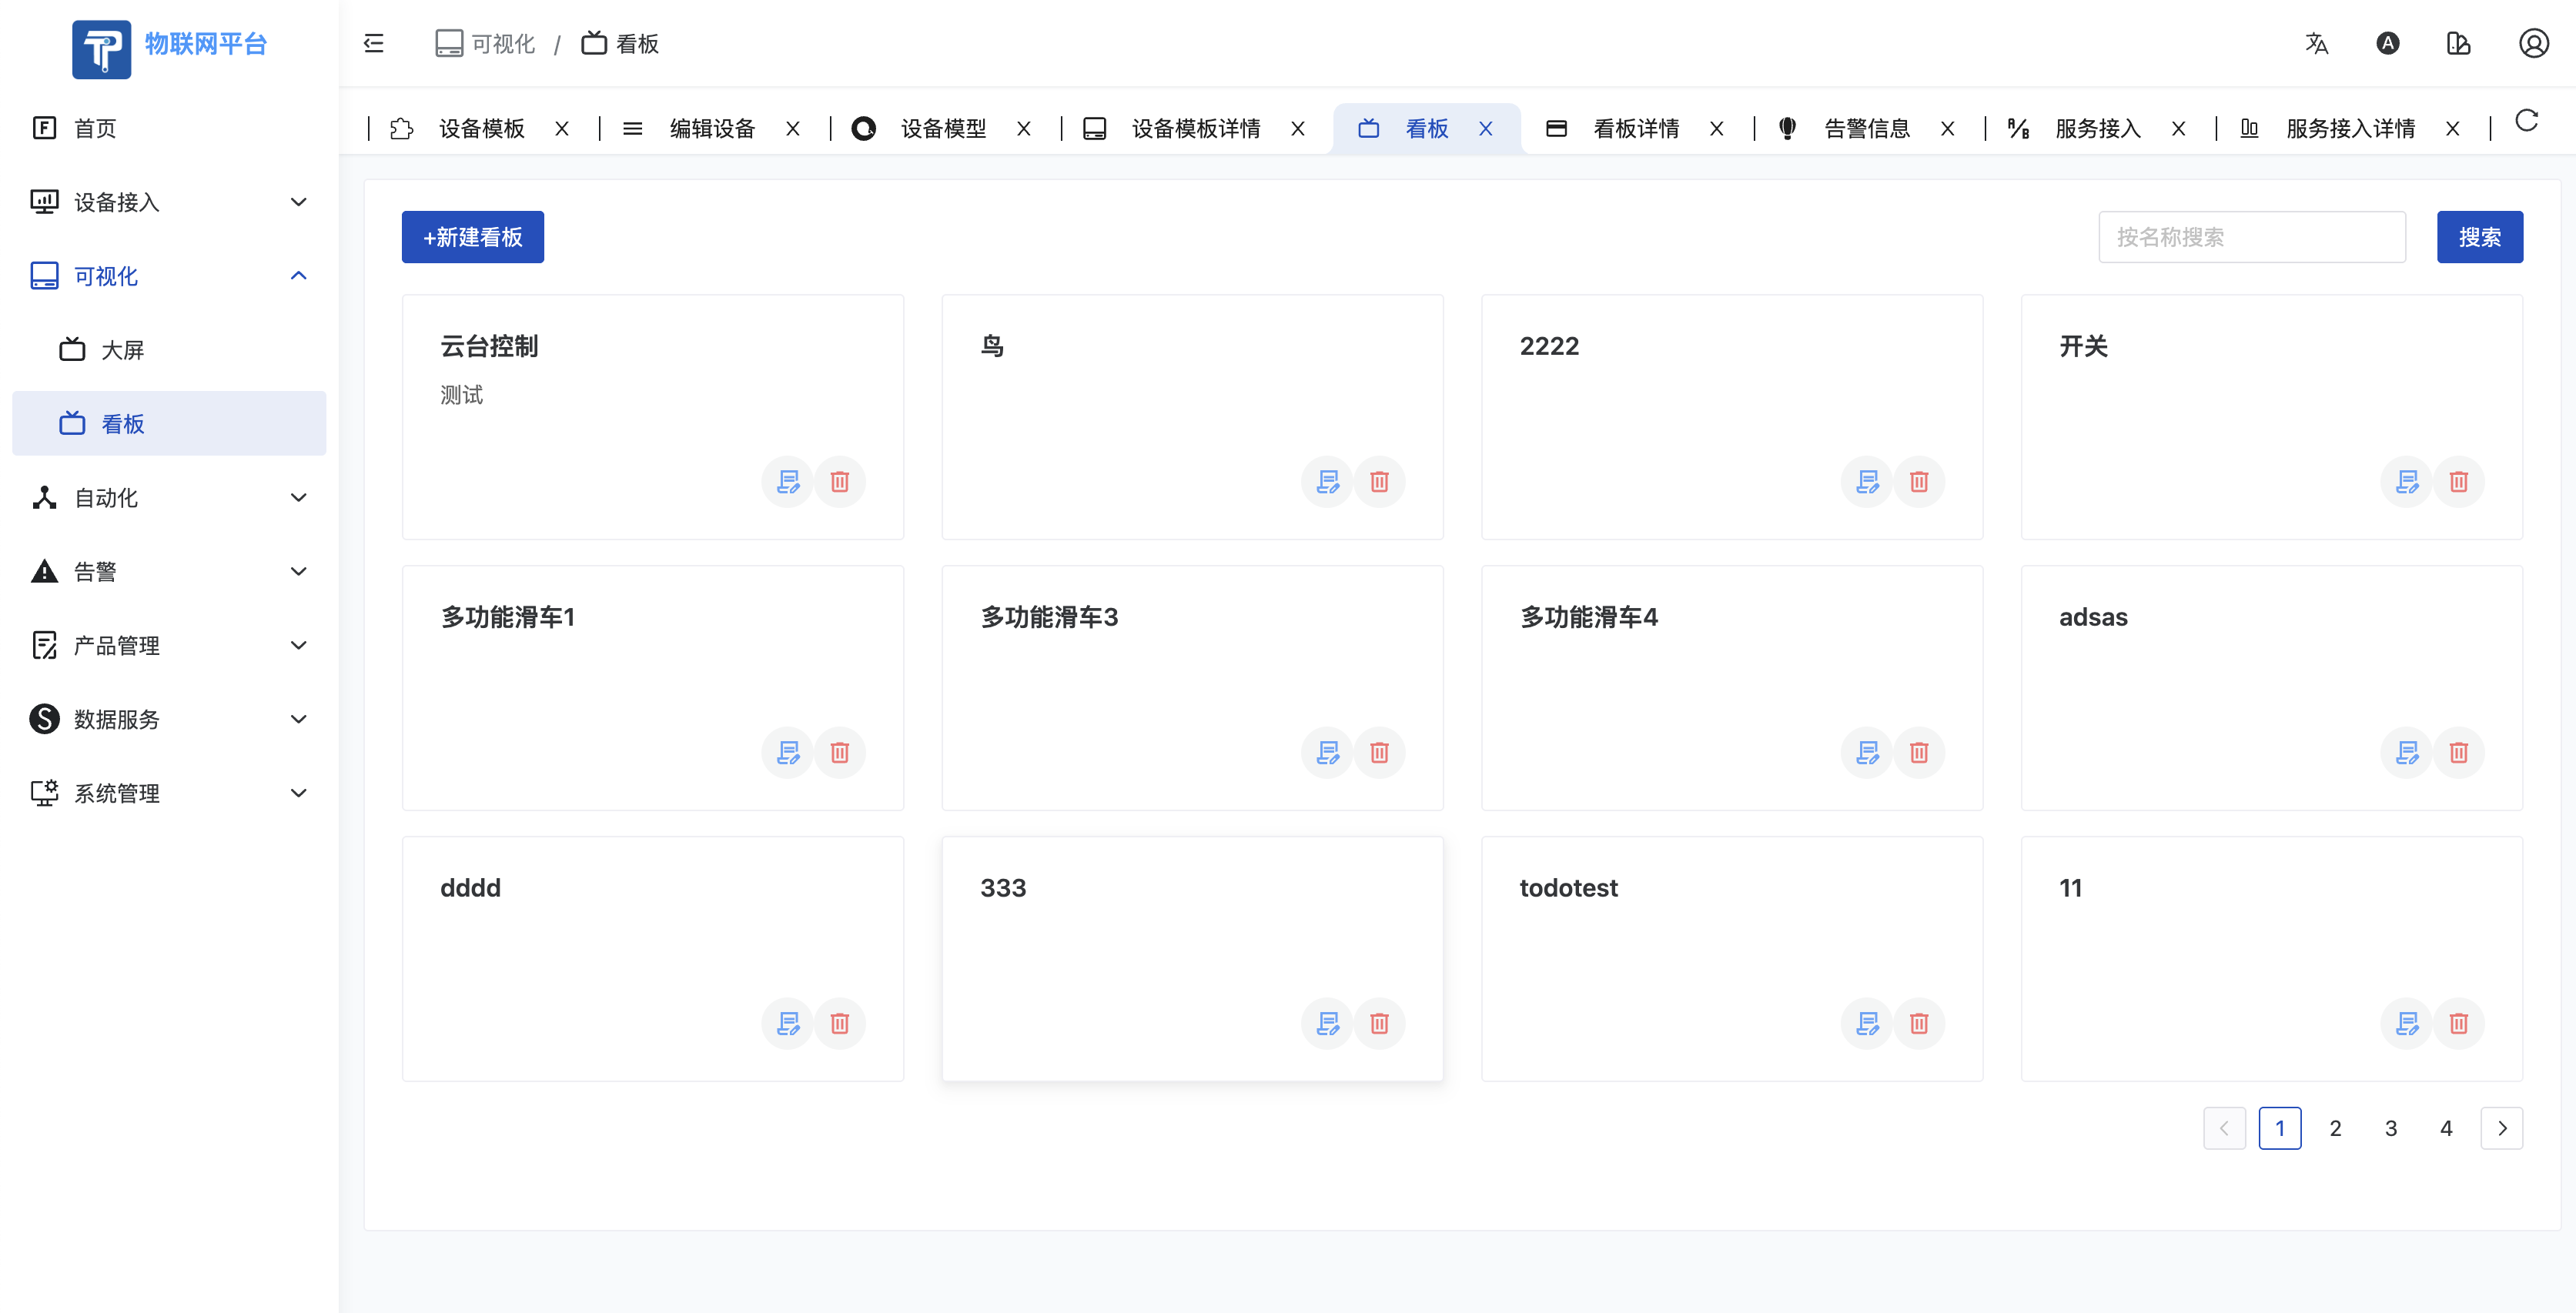
- Click Visualization - Dashboard to enter the Dashboard Management page. This part has the same functions as the System Administrator Dashboard.
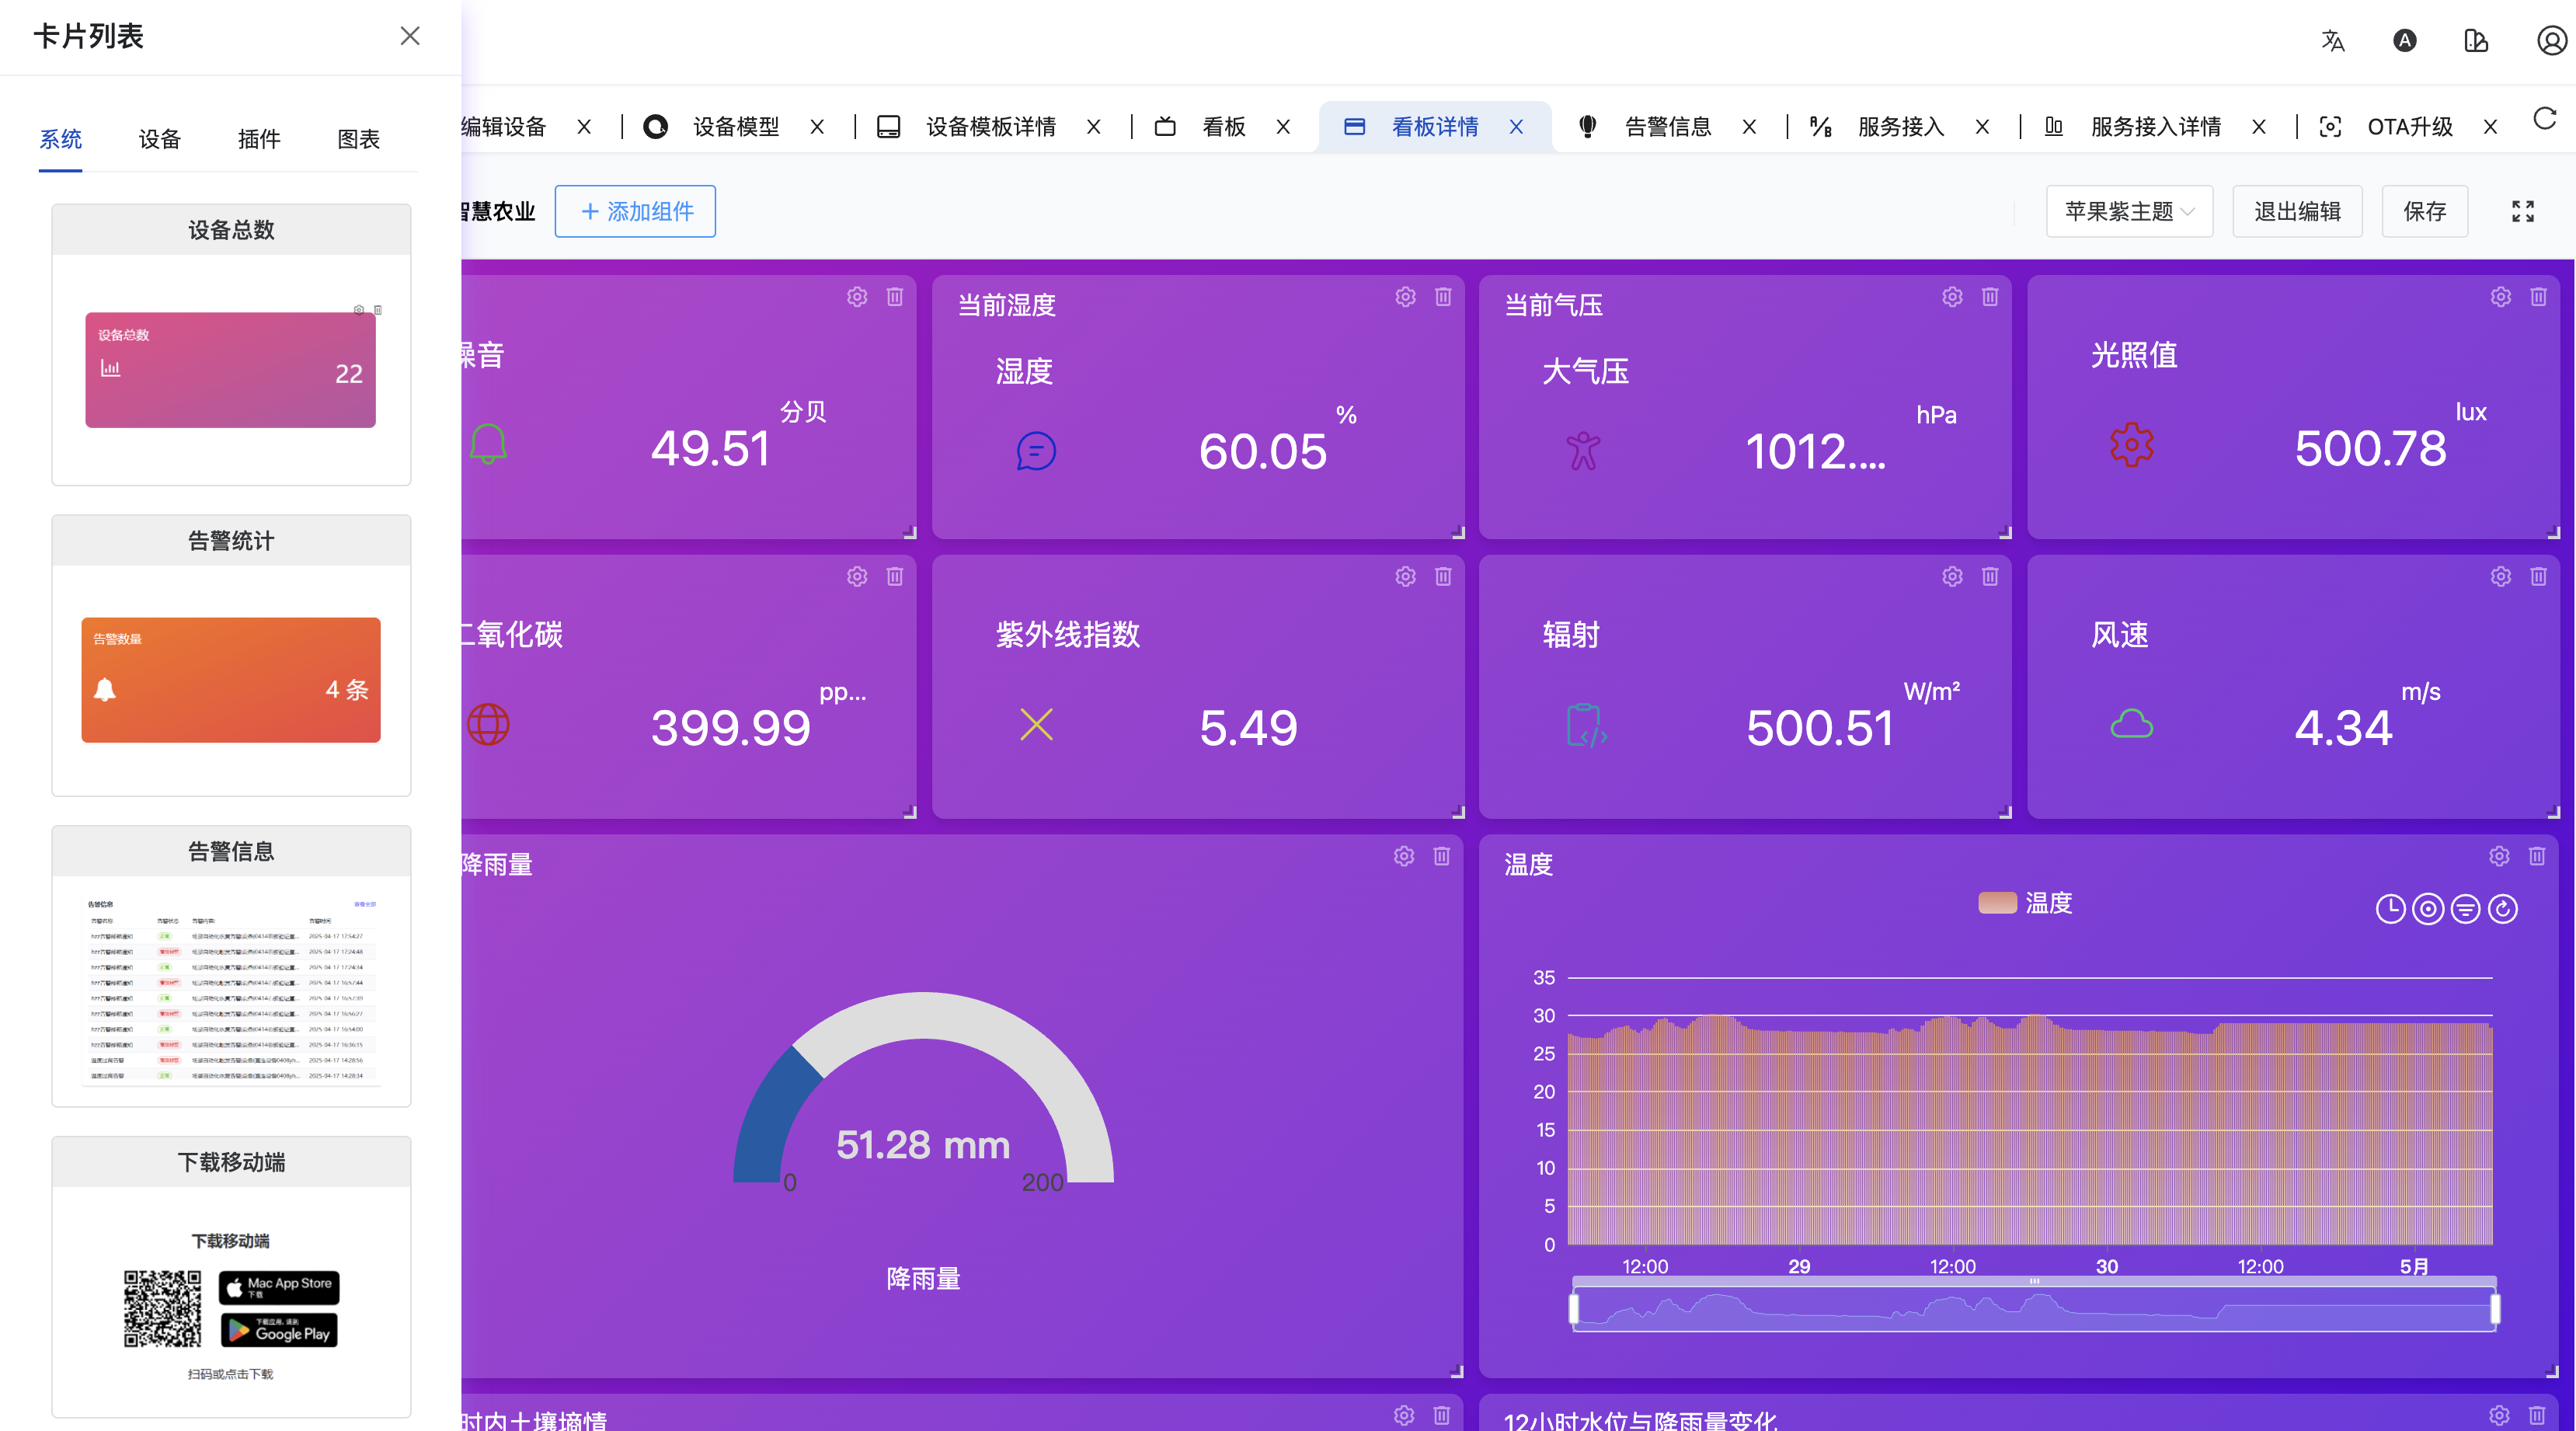
- Components vary by permissions.
- System Tag supported components:
- Total Devices
- Online Devices
- Offline Devices
- Device Online Rate
- Device Offline Rate
- Device Online Trend
- Operation Guide
- Recent Access
- Latest Reported Data
- System Metric History
- Monthly User Growth
- Value Control
- Tenant Count
- Version Info
- CPU Usage
- Memory Usage
- Disk Usage
- App Download
- Alarm Info
- Alarm Stats
- Chart Tag supported cards:
- Digital Indicator
- Bar Chart
- Line Chart
- Value Control
- Data Issue (Downlink)
- Enum Control
- Gauge
- Status Card
- Device Switch Control
- Table
- Player
- Text Info
- Device Tag:
- Supports dragging charts bound to selected devices directly, very convenient.
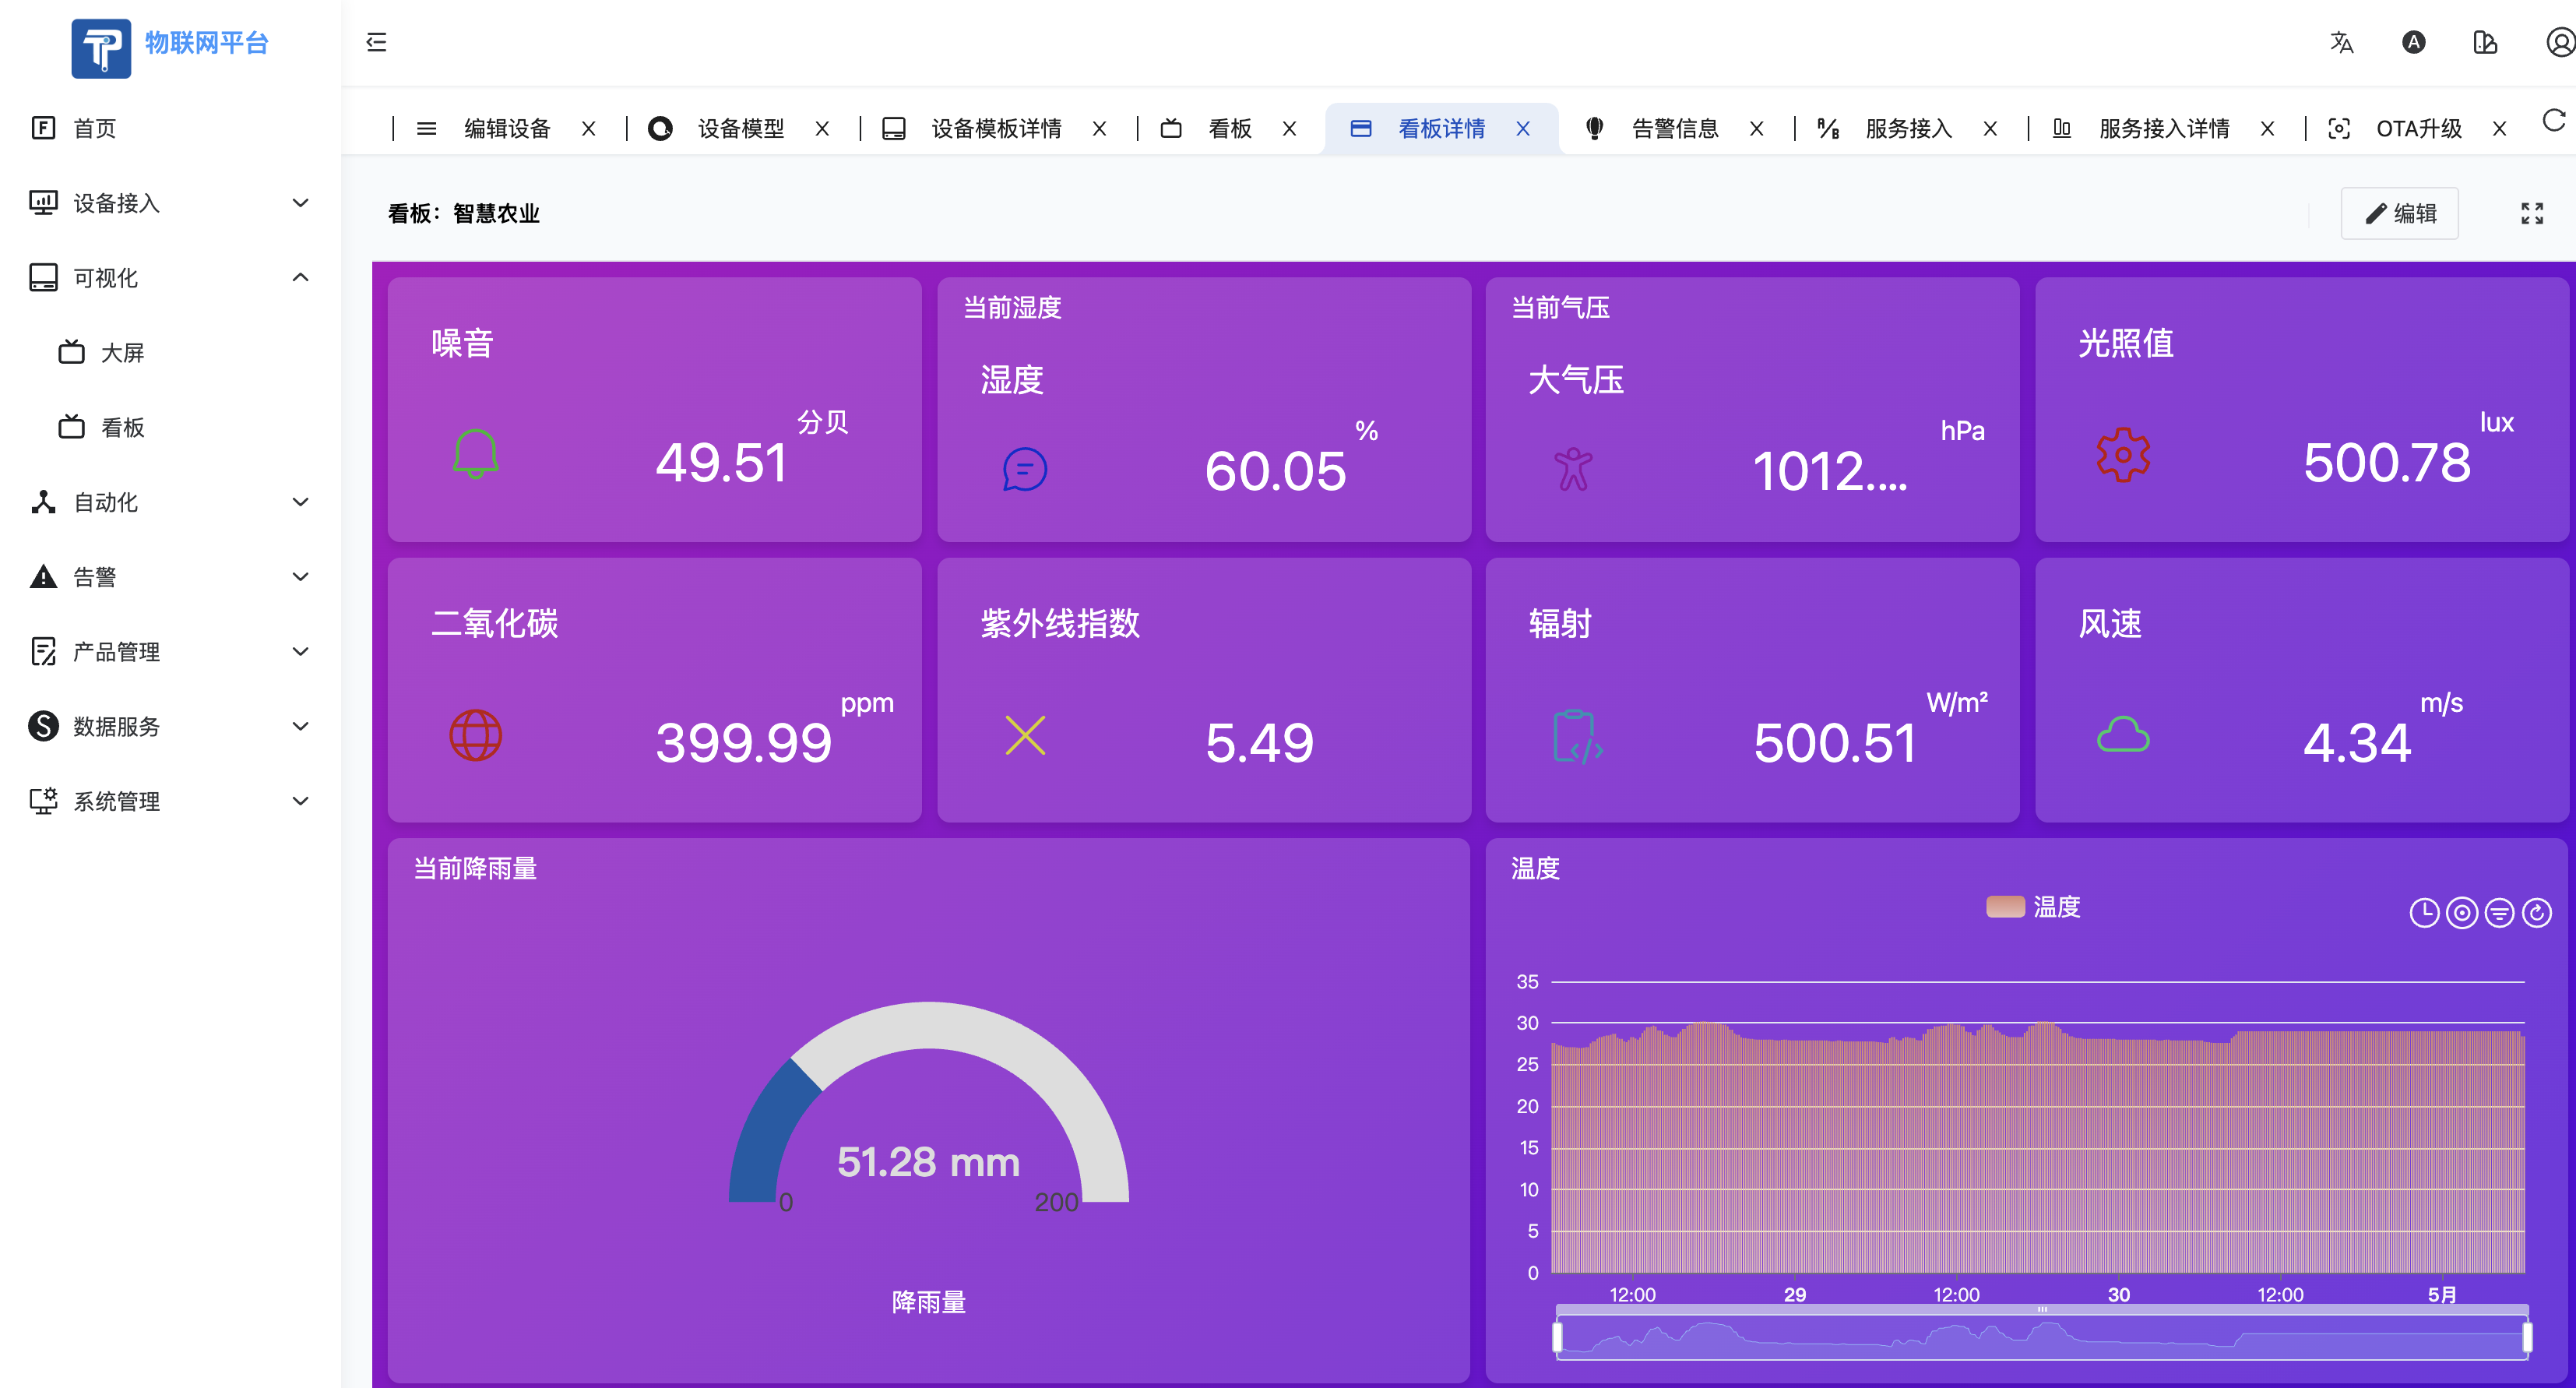
Dashboard View
Dashboard Edit
Dashboard List